Power BI Reporting & Analytics Dashboard
How I designed reporting and analytics dashboards that transformed operational data into actionable insights, improving visibility, decision-making, and performance tracking across business processes.
In this article
Overview The challenge Dashboard design Implementation example Visual examples Comparison table Project highlights FAQOverview
A dashboard is only valuable when it helps people make better decisions. In this project, my focus was not just on creating attractive charts in Power BI, but on building a reporting layer that translated operational data into meaningful business insight.
The work involved understanding the reporting questions stakeholders actually cared about, cleaning and reshaping data, defining measures, and designing dashboards that made performance, trends, bottlenecks, and service demand easier to see. The result was a reporting experience that supported both day-to-day operations and higher-level decision-making.
The challenge
Most organisations already have data, but that does not automatically mean they have insight. Operational data often sits across different systems, formats, and levels of quality. Even when reports exist, they may be static, fragmented, or too detailed to support quick decisions.
The challenge was to transform raw and sometimes inconsistent data into a reporting model that could be trusted. That meant improving data structure, creating measures that reflected the real business logic, and presenting results in a way that both technical and non-technical stakeholders could understand.
Key reporting challenges
- Data spread across multiple sources and formats
- Inconsistent fields and naming conventions
- Need for trend analysis, not just raw totals
- Requirement for both operational and management views
- Balancing detail with readability
- Making dashboards useful for real decisions, not just display
Dashboard design
My approach to Power BI reporting usually follows a structured path: understand the business questions, clean the source data, design a reporting model, create measures, and then build a dashboard layout that tells a clear story.
1. Business-first reporting structure
Before building any visuals, I focused on what the dashboard needed to answer. For example: What is increasing? What is slowing down? Which categories drive the highest volume? Where are service pressures appearing? Good dashboards begin with questions, not chart types.
2. Data shaping and modelling
Power Query played a major role in transforming messy source data into a cleaner structure. This included renaming columns, standardising values, handling blanks, reshaping tables, and preparing the dataset for reliable modelling in Power BI.
3. Measures that reflect business logic
DAX measures are where reporting becomes genuinely useful. Totals alone rarely tell the full story. Measures for growth, year-to-date comparisons, category share, rolling trends, and operational KPIs make the dashboard far more decision-ready.
4. Clear visual hierarchy
A dashboard should guide the eye. High-level KPIs, trend visuals, category breakdowns, and drill-down views should work together so the user can move naturally from summary to detail.
Source data
    ↓
Power Query transformation
    ↓
Clean reporting model
    ↓
DAX measures and KPIs
    ↓
Dashboard visuals and filters
    ↓
Operational insight and management reporting
This structure made the reporting solution easier to maintain and easier to extend as business questions evolved.
Implementation example
A key part of this work was defining useful measures rather than relying only on raw columns. The example below shows a simple DAX pattern for a year-over-year comparison, which is the kind of logic that helps turn counts into meaningful trends.
Total Applications = SUM(Applications[Count])

Previous Year Applications =
CALCULATE(
    [Total Applications],
    DATEADD(Calendar[Date], -1, YEAR)
)

Year on Year Change =
[Total Applications] - [Previous Year Applications]

Year on Year % =
DIVIDE(
    [Year on Year Change],
    [Previous Year Applications],
    0
)
Measures like these make it easier for stakeholders to move beyond “what is the total?” and instead ask “what is changing?”, which is usually the more important business question.
In practice, the reporting solution typically combined Power Query, data modelling, DAX, filters, and carefully structured visual design.
Visual examples

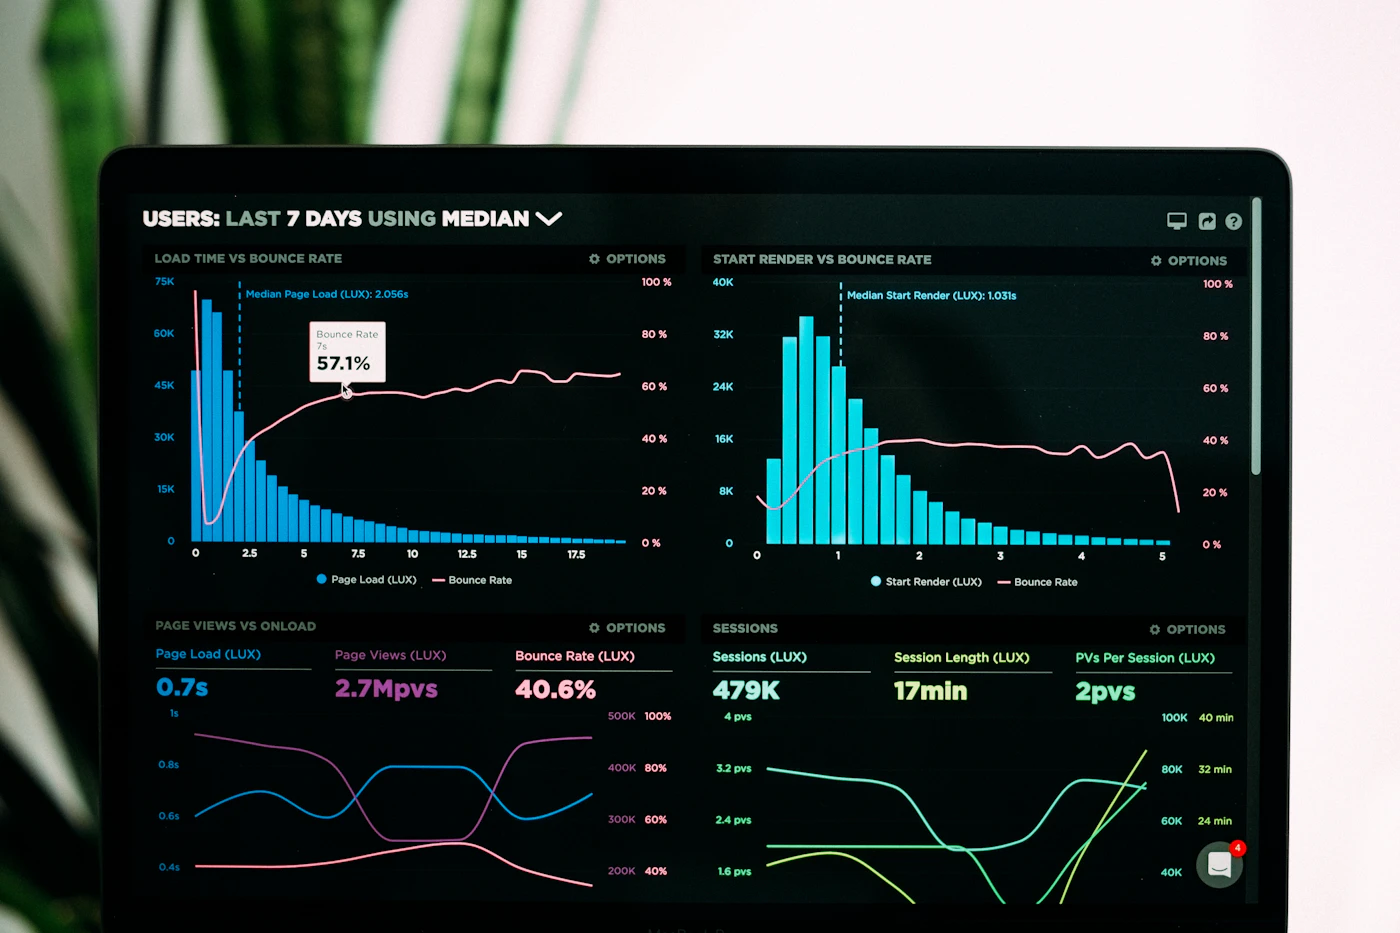
The most effective visuals are the ones that make patterns obvious. Trend lines, KPI cards, category comparisons, and filters can work together to show not only what is happening, but where to investigate next.
Comparison table
| Approach | Strength | Trade-off |
|---|---|---|
| Static spreadsheet reporting | Quick to produce | Harder to explore and scale |
| Basic dashboard with raw totals | Easy to read at first glance | Limited analytical depth |
| Power BI analytics dashboard | Interactive, scalable, and insight-driven | Requires stronger data modelling upfront |
Project highlights
Business value
The strongest outcome of this project was better decision-making. By giving teams clearer visibility into trends, workloads, and patterns, the dashboard helped shift reporting from hindsight to action. It also reduced reliance on manual reporting and made it easier to answer common stakeholder questions consistently.
- Improved visibility across operational performance
- Reduced manual reporting effort
- Enabled faster trend and category analysis
- Supported better business decisions with clearer data
- Created a stronger foundation for future analytics work
Want reporting that goes beyond static dashboards?
I design analytics solutions that combine data cleaning, modelling, business logic, and visual storytelling to make reporting genuinely useful.
Contact MeFAQ
Was this just a visual dashboard project?
No. The real work was in shaping the data, defining the right measures, and structuring the reporting logic behind the visuals.
What made this dashboard valuable to the business?
It improved visibility, reduced manual reporting, and gave stakeholders a clearer understanding of trends and performance drivers.
What tools were central to the solution?
Power BI, Power Query, DAX, and structured data modelling were the main building blocks.